Charts
When starting Forex Simulator, it will automatically open one H1 chart for every selected instrument. You can recognize simulator's charts by their names which end with .sim or .fsim. You can work with these charts in the same way as you work with other charts. You can use all drawing tools available in Metatrader to add markup.
Opening Charts
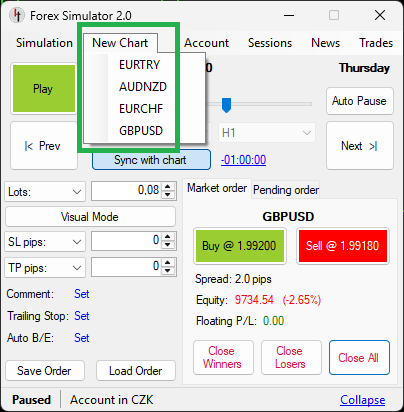
To open a new chart click on New Chart in main menu and choose the instrument from the drop-down list. The chart should open immediately.
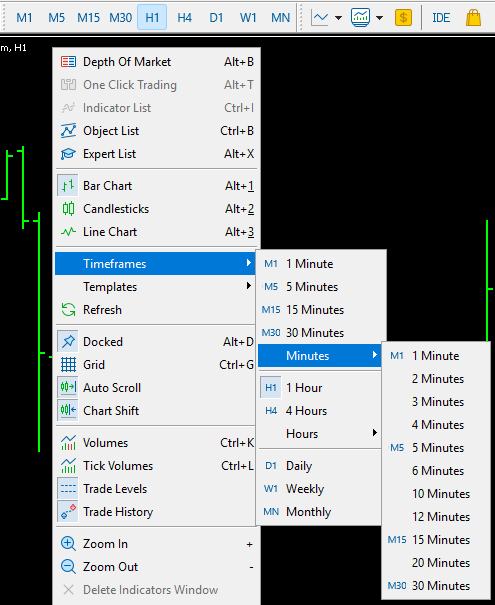
To change timeframe use the buttons in Metatrader's top menu or right-click on the chart and choose Timeframes.
The following timeframes are available on Metatrader 5:
- M1, M2, M3, M4, M5, M6, M10, M12, M15, M20, M30
- H1, H2, H3, H4, H6, H8, H12
- Daily, Weekly, Monthly
Control Buttons
Every chart opened by the simulator is equipped with 6 control buttons in its top right corner. These buttons turn on and off the following functions:

- Sync
Synchronization of drawings between this chart and other charts. - History
Show/Hide the history of trading (closed trades) - Trades
Show/Hide open market trades and pending orders - Avg
Avg stands for average position. When you have at least two trades of the same type (e.g. two buys or two sells), Avg button will show you the average position of these trades as a line on the chart, separately for buy orders and sell orders. - News
Show/Hide economic events - [+]
Show/Hide Control Buttons
Indicators
You can use all standard (built-in) MT5 indicators such as RSI, MA or ATR. So you can use every indicator which comes with Metatrader 5.
Custom indicators
Unfortunately, not every custom indicator will work correctly on the simulator. Some will work fine. Some may need small adjustments in the source code. Sometimes they just won't work. It is because the environment created in the simulation is a bit different from live environment. Some MQL5 functions used in custom indicators may not work correctly in the simulation.
Templates
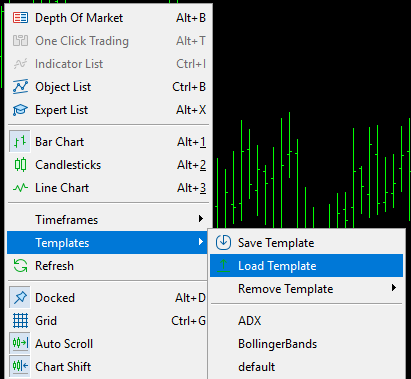
You can use chart templates on the simulator, as you normally do on Metatrader. You can apply a template to the chart with right-click on the chart -> Templates -> Load Template or from Metatrader's menu.
Auto-loading templates
If you save a template as default (default.tpl), it will be loaded automatically for every newly opened chart.
Synchronizing Objects (Drawings)
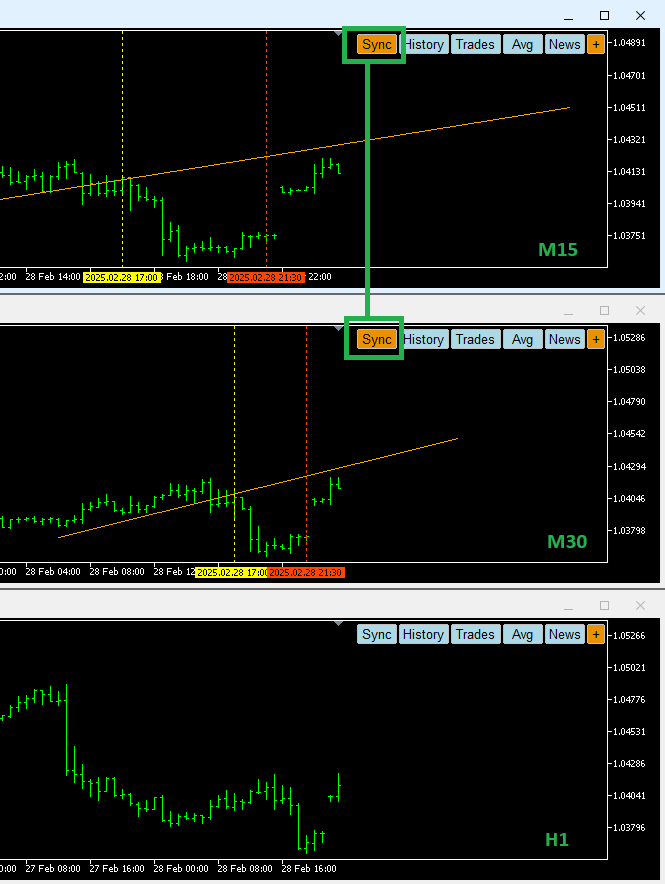
Forex Simulator lets you synchronize objects drawn on charts automatically. All you need to do is to enable Sync buttons on the charts you would like to synchronize. Charts where Sync button is disabled will not be synchronized.
Below you can see an example of synchronizing M15 and M30. H1 is excluded. All new objects drawn on M15 will automatically appear on M30. In the same way, all objects created on M30 will automatically appear on M15. All changes made to an object on one of these charts will be reflected on the other chart immediately. Deleting an object from one of them will also delete it from the other chart.
Synchronization works only for charts showing the same instrument. It is not possible to synchronize drawings between different currency pairs.
How to copy existing objects
If you already have a bunch of objects on one chart and you would like to copy them to other chart, enable Sync buttons on both charts and click on every object which you would like to copy. Clicking on the object will force the simulator to synchronize it.
Do not change names!
Forex Simulator recognizes user drawings by their names. It relies on the default naming convention used by Metatrader, for example: M15 Trendline 34525 or H1 Text 29884.
If you change the name of an object, the simulator may no longer be able to synchronize it. It is safer to leave default names intact to avoid problems with synchronization.
Review Mode
When the simulation is running, range of time visible on charts is limited in order to save resources and optimize performance. By default, you can only see the last few months on every chart. This period is called lookback. Lookback can be adjusted to some extent in Simulation -> Options in main menu.
The picture below shows how a sample lookback of 3 months affects visibity of data on the chart. This sample simulation was started from 2018 and it has been running until May 2020. At this point of time you can only see the last 3 months of data (from Feb 2020 to May 2020). All previous history is not visible.
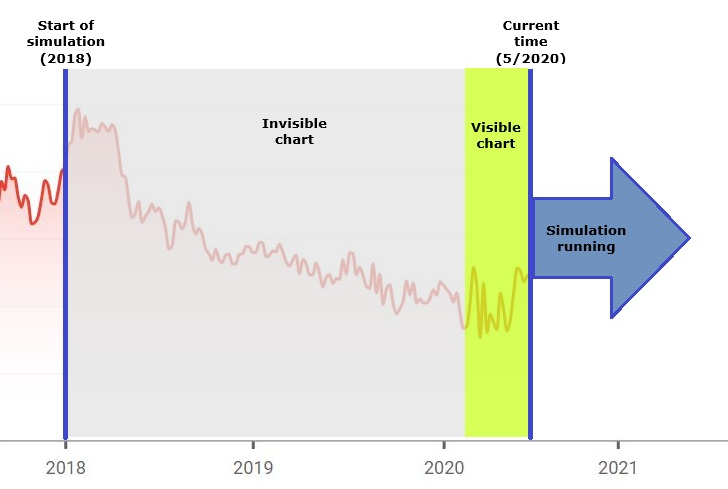
This works well most of the time. However, it becomes a problem when you want to review the history of trading. In such situation Review Mode will help you. Review Mode lets you see the whole range of simulation on charts so that you can study your trading history.
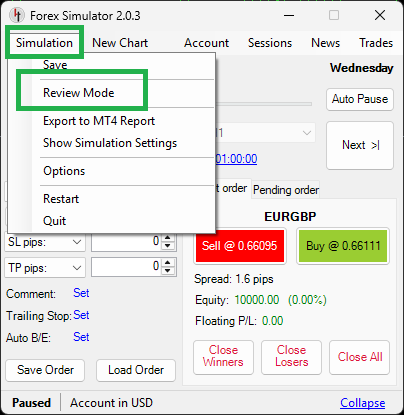
You can enter Review Mode by going to Simulation -> Review Mode in simulator's main menu.
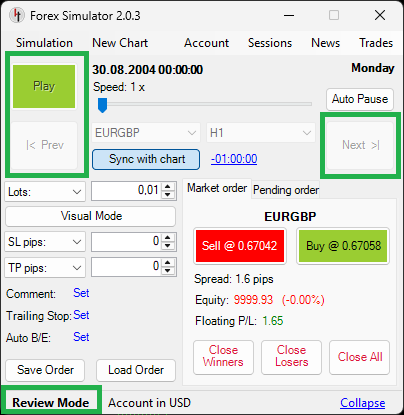
When Review Mode is enabled, the simulator will display this fact in its bottom left corner. Also, the simulation will be paused and all navigation buttons will be disabled. It is not possible to run the simulation or move forward/backward in Review Mode.
When you decide to finish studying the charts and you would like to continue trading, you can leave Review Mode by going to Simulation -> Review Mode again.
Max bars in chart
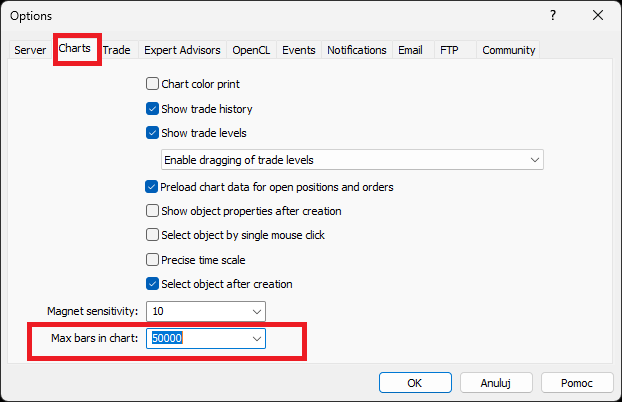
The length of charts may also be limited by Metatrader settings. If you can't see whole history even after entering Review Mode, go to Tools -> Options -> Charts in Metatrader's top menu and set Max bars in charts to Unlimited.
Unfortunately, changing this setting takes effect only after restarting Metatrader, so you may need to save your simulation, restart MT5 and then load it back.
