Charts
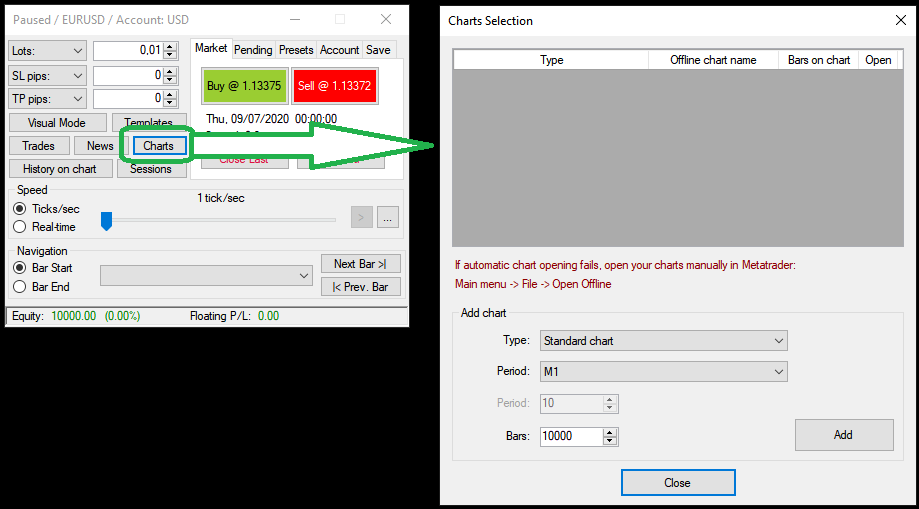
Just after starting the simulation Charts Selection window should appear. This window lets you create and open charts to work with. You can also open this window during the simulation using Charts button in the main window.
Creating and Opening Charts
A new chart can be opened in 3 steps, which are marked in the picture below:
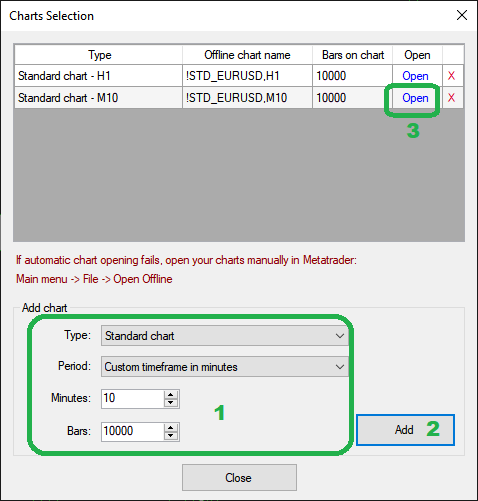
Step 1
Choose the type of chart and other settings from the boxes in the bottom of the window. Following types of charts are available:
- Standard
- base: M1, M5, M15, M30, H1, H4, D1, Weekly, Monthly
- custom: M1 - M1440, H1 - H24, D1 - D6
- Seconds
1 - 3600 seconds - Range
- Renko
- Tick
1 - 10 000 ticks
Step 2
Click Add to add the new chart to the list on the top of the window. The simulator will now create a new chart. It may take some time so you will see a progress bar.
Step 3
Click Open to open the chart in Metatrader. The same chart can be opened several times.
You can close the window when all charts are ready. You will be able to access it at any time later.
Changing timeframes
Unfortunately, it is not possible to switch the timeframe of the chart. Forex Simulator uses offline charts and offline charts on Metatrader are always fixed to one timeframe. So the only option is to open several charts (several timeframes) and switch between them.
How to open a chart in case of problems
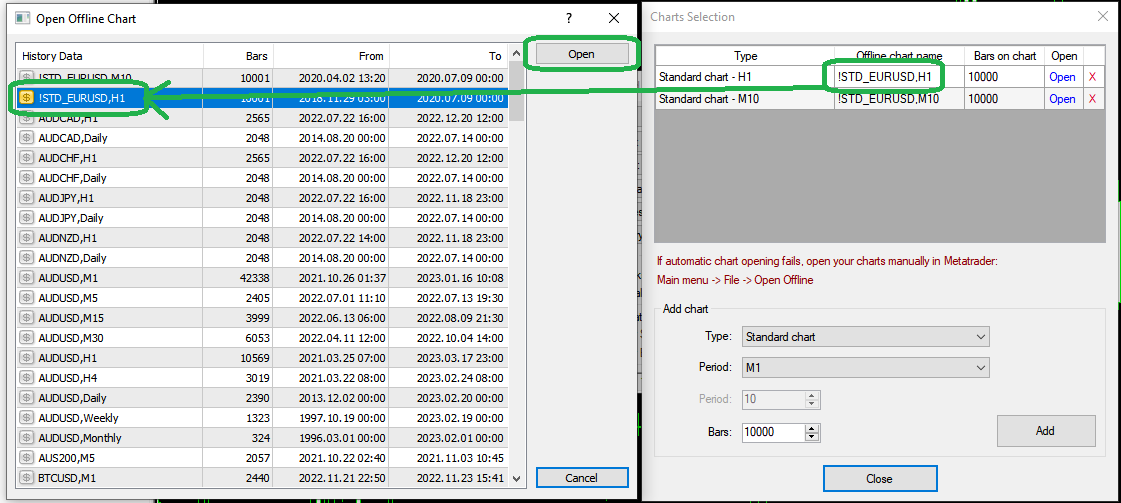
If, for any reason, Open button doesn't work in your case, you can also open the chart manually from the list of offline charts in MT4.
- Go to File -> Open Offline. A list of offline charts will appear.
- Select the corresponding chart from the list. You should look for the same name as in Offline chart name column in Charts Selection window.
- Click Open in Open Offline Chart window.
Control Box
Every chart opened by the simulator is equipped with a small control box in its corner. It shows the type of chart, current time and day of week. It also lets you perform a few simple actions:
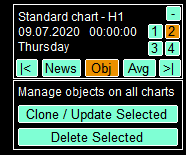
- -/+
Show/Hide control box - 1, 2, 3, 4
Choose a corner to display control box - [|<] and [>|]
Step one bar backward or forward - News
Show/Hide economic events on this chart - Obj
Show/Hide the lower part of control box - Avg
Avg stands for average position. When you have at least two trades of the same type (e.g. two buys or two sells), Avg button will show you the average position of these trades as a line on the chart, separately for buy orders and sell orders. - Clone/Update Selected
Copy all selected objects from this chart to all other charts (see Drawing Objects) - Delete Selected
Remove all selected objects from this chart and all other charts (see Drawing Objects)
Indicators
You can use all standard (built-in) MT4 indicators such as RSI, MA or ATR. So you can use every indicator which comes with Metatrader 4.
Custom indicators
Unfortunately, not every custom indicator will work correctly on the simulator. Some will work fine. Some may need small adjustments in the source code. Sometimes you may be able to make them work by opening charts of other timeframes. Sometimes they just won't work, no matter what. It is because the simulator creates new symbols, for example !STD_EURUSD instead of EURUSD, and it uses offline charts. The environment created in the simulation is a bit different from live environment. Some MQL4 functions used in custom indicators may not work in the simulation.
Templates
You can use chart templates on the simulator, as you normally do on Metatrader. You can apply a template to the chart with right-click on the chart -> Template or from Metatrader's menu.

Auto-loading templates
If you save a template as offline (offline.tpl), it will be loaded automatically for every newly opened chart on the simulator.
Drawing Objects
You can use all drawing tools available in Metatrader during the simulation.
Unfortunately, it is not possible to switch the timeframe of the chart. Forex Simulator uses offline charts and offline charts on Metatrader are always fixed to one timeframe. So the only option is to open several charts (several timeframes) and switch between them.
However, this makes multi-timeframe analysis more difficult, because objects drawn on one chart (e.g. trendlines) do not automatically appear on other charts (timeframes).
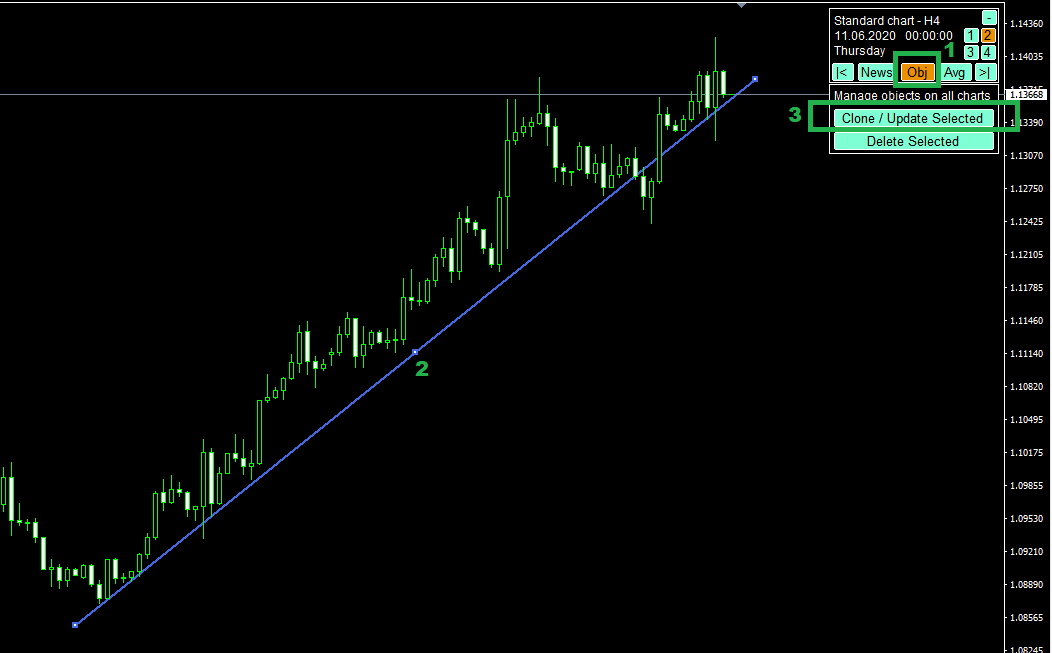
The solution is to clone objects between charts. It can be done in the following way:
Step 1
Make sure that Obj button is enabled in Control box so that you can see the lower part of this box.
Step 2
Select objects which you would like to clone, for example a trendline. You can select objects with a single-click or a double-click depending on your settings in Metatrader.
Step 3
Click Clone/Update Selected in Control box. Selected objects will be cloned to all other charts.
If you change the position, color or other setting of your objects, you can apply these changes to other charts using the same button.
In the same way, you can delete selected objects from all charts using Deleted Selected button.
Useful options
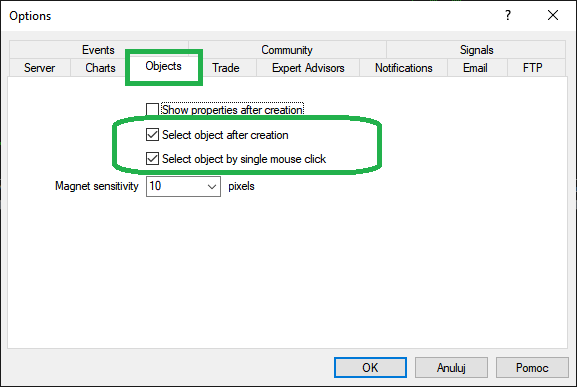
You can automate selecting objects after creation if that helps you. You can do it in Tools -> Options -> Objects in Metatrader's main menu.
