Using Broker's Data
Although broker's historical data usually offers lower quality than tick data from Dukascopy, TrueFX or HistData, it may still be beneficial to use it in some cases, for example:
- The instrument you would like to simulate is not offered by these providers.
- You would like to train using exactly the same data as you are going to use for live trading in the future.
Limitations
❌ No tick data
MT4 is not capable of storing tick data. It stores OHLC data, which means only 4 real prices per candle: open, high, low and close. The most accurate timeframe that is available is M1, which gives you 4 real prices per minute. However, it usually covers a very short range of time. Higher timeframes cover wider range of time, but they are less accurate.
❌ No renko, range, tick and seconds charts
Price action charts are turned off, because there is too little information about real price action. Ticks inside each candle are generated in random way. Displaying charts based on random movement would be misleading for users.
❌ Timeframes are limited to multiples of base timeframe
For example, if you choose to use M15 data from the broker, you will be able to create charts such as M15, M30, M45, H1, ... , but not M1, M5 or M20.
❌ No time modes
In case of Dukascopy, HistData and TrueFX you can choose between GMT and New York Close charts. There is no such possibility in case of broker's data. The only available time zone is the time zone used by your broker.
❌ No variable spread
Since Metatrader does not store any information about historical spreads, only fixed spread is available.
❌ No economic calendar
The reason for such limitation is that the simulator does not know the time zone used by your broker in the past. Moreover, it has no idea if and when your broker operated on Daylight Saving Time (DST). Therefore, it is impossible to correctly match economic events with charts.
❌ No sessions window
The reason for such limitation is that the simulator does not know the time zone used by your broker in the past. Moreover, it has no idea if and when your broker operated on Daylight Saving Time (DST). Therefore, it is impossible to correctly match trading sessions (New York, London, Tokyo, ...) with charts.
Downloading Data from Broker
Before starting the simulation you should force Metatrader to download as much historical data as possible from your broker and store it on your computer. Unfortunately, there is no direct way of doing that, because Metatrader downloads data only when it needs it. Nevertheless, you can usually force it to download data by scrolling the chart backwards as much as possible.
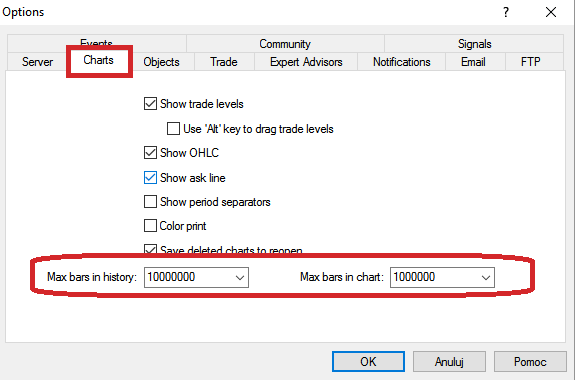
Step 1
Go to
Tools -> Options -> Charts in
Metatrader's main menu and set both
Max bars in history and
Max bars in chart to a very large
number, for example 1000000. Click
OK.
Step 2
Restart Metatrader so that these changes can take effect.
Step 3
Open a live chart of the instrument you would like to use in your simulation. Switch the chart to your preferred base timeframe.
What is Base Timeframe?
It is a timeframe that will be used as a source of data. The simulator will build other charts (higher timeframes) from this source. Only higher timeframes can be built. It is not possible to build lower timeframes.
For example, if you choose M15 as base timeframe, you will be able to create M15, M30, H1, H4, ... . However, M1 and M5 will not be available.
Taking that into account, it may sound like choosing M1 is always the best option, because it will let you create every chart. Unfortunately, broker's data is usually very short on M1 so you may get only a few months of it. This may not be enough for a reliable simulation.
On the other hand, selecting a higher timeframe will let you run a longer simulation with lower quality. Choosing base timeframe is a trade-off between the length of simulation and its quality.
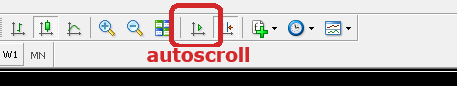
Step 4
Disable autoscroll in Metatrader's top menu. This will let you scroll the chart backwards.
Step 5
Scroll the chart into the past as far as you can. You can do it using Home key or with your mouse. Do it as long as more bars appear. Scrolling the chart backwards will force MT4 to download all available data.
Step 6
Restart Metatrader again. This will force it to write downloaded data to your disk.
History Center
You may be tempted to go to Tools -> History Center and simply click Download. However, it may not be a good idea.
Be advised that this button will download data from Metaquotes, not from your broker! It may lead to having mixed data and other problems. In general, using this button should be avoided unless you know exactly what you are doing.
Starting the simulation
Step 1
Start Forex Simulator and choose New Simulation.
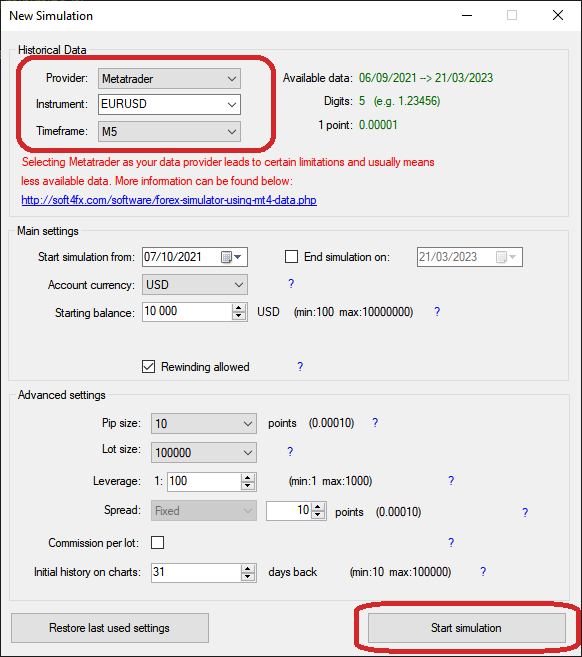
Step 2
In the Provider box select Metatrader. Choose the instrument. Select your base timeframe in Timeframe box.
Adjust other settings and click Start simulation.
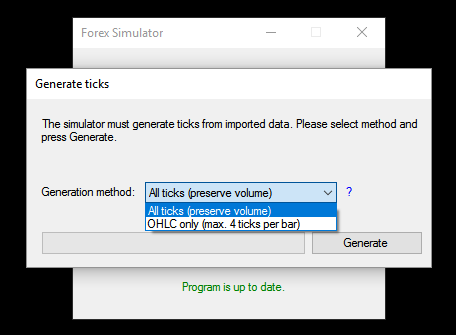
Step 3
Tick generation window will appear. Since Forex Simulator works with tick data, it needs to convert broker's candle data (open-high-low-close, OHLC) into tick data before starting the simulation.
MT4 brokers do not offer tick data, only OHLC data. Even if you choose M1 as base timeframe, you will only get 4 real prices for each 1-minute candle (open, high, low and close). If candle's volume exceeds 4, the simulator can generate all remaining ticks and price movements inside this candle in random way to preserve its original volume.
You can decide if you want it by choosing one of modes below:
-
All ticks (preserve volume)
The simulator will generate as many ticks as is needed to match the volume of each candle of broker's data. Ticks will be generated randomly so you should not rely on any intra-candle price movements! -
OHLC only (4 ticks per bar)
The simulator will create only 4 ticks per candle based on open, high, low and close prices from broker's data. Volumes will not be preserved. Every candle will have a volume of 4. However, there will be no random price movements.
OHLC vs All Ticks
The simulation will usually be faster when using OHLC only mode, but volumes displayed on charts will not be real. Some indicators, which are based on volumes, may fail because of that.
All Ticks mode may be slower, but offers real volumes. However, please remember that most ticks inside candles are just random, so you should not rely on any intra-bar movements.
Click Generate and wait for the process to finish. It may take some time.
Step 4
When tick data is ready, click Start simulation to begin.